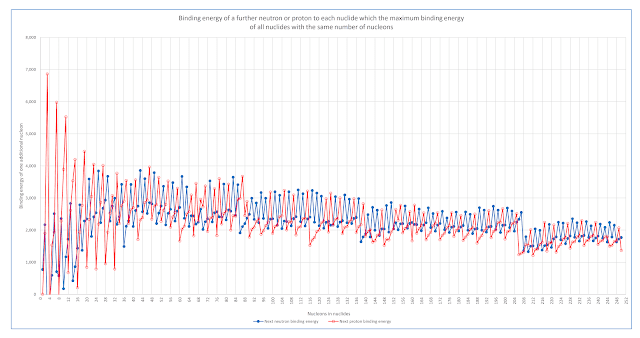
A large amount of data is now available on isotopes of all elements.
The data includes measurements of the atomic weights of many isotopes of elements - with isotopes that contain many different numbers of neutrons for each element.
Because nuclear binding energies of neutrons are so large - compared to electron binding energies - the difference on the atomic weights of isotopes can be used to calculate the binding energies of individual neutrons and collections of neutrons.
For instance, typical binding energies are in the order of 9 million electron volts which is approximately 1 percent of the mass of an isolated neutron. This is equivalent to converting the mass of about 18 electrons into energy.
For chemical reactions, binding energies are typically in the order of just a few electron volts.
The National Institute of Standards and Technology - NIST
The U.S. government agency NIST Physical Measurement Laboratory maintains a table of atomic weights of isotopes of all elements.
It is available on the NIST web site page "Atomic Weights and Isotopic Compositions with Relative Atomic Masses" by selecting the options "All Elements" and "All isotopes".
This returns a table with details for over 3,000 isotopes.
Following are examples of 4 charts prepared by examining neutron binding energies and attempting to identify patterns.
Each chart use a simplified binding energy scale where 1 represents 2,887 electron volts. On this scale, neutron binding energy values are typically around 3,000 of these units.
Each chart shows binding energy for individual neutrons in two different elements . These are shown on the left axis.
Note that even-numbered neutrons have slightly higher binding energies than the odd-numbered neutrons, and the binding energy gradually declines as increasing numbers of neutrons are added while the number of protons in the nucleus is kept constant. With the addition of protons, the neutron binding energies are higher.
The sum of the binding energies of selected neutrons are shown on the right axis.
Chart 1
Binding Energies of Neutrons in Yttrium which has 39 Protons and Niobium which has 41 Protons.
Chart 1 shows that the neutron binding energies drop after the first 50 neutrons in each nucleus, and dip slightly after the first 56 neutrons.
In Yttrium, the sum of the binding energies of the 8 neutrons from 53 to 60 is exactly the same as that of the 8 neutrons from 57 to 64 in Niobium. This is with an increase of two protons from Yttrium with 39 protons to Niobium with 41 protons.
Chart 2
Binding Energies of Neutrons in Yttrium which has 39 Protons and Indium which has 49 Protons.
Chart 2 again shows that the neutron binding energies drop after the first
50 neutrons in each nucleus, and dip slightly after the first 56
neutrons in Yttrium - that has 39 protons. This dip does not appear in Indium that has 10 additional protons in its nuclei.
In Yttrium, the sum of the binding energies of the 12 neutrons from 58 to 69 is
exactly the same as that of the 6 neutrons from 58 to 63 in Indium. This is with an increase of ten protons from Yttrium with 39 protons to Indium with 49 protons.
Chart 3
Binding Energies of Neutrons in Bromine which has 35 Protons and Indium which has 49 Protons.
Chart 3 again shows that the neutron binding energies drop after the first
50 neutrons in each nucleus.
In Bromine, the sum of the binding energies of the 20 neutrons from 38 to 57 is exactly the same as that of the 20 neutrons
from 58 to 77 in Indium. This is with an increase of fourteen protons from
Bromine with 35 protons to Indium with 49 protons.
Chart 4
Binding Energies of Neutrons in Gallium which has 31 Protons and Arsenic which has 33 Protons.
Chart 4 again shows that the neutron binding energies drop after the first
50 neutrons in each nucleus.
In Gallium, the sum of the binding energies of the 16 neutrons from 41 to 56 is exactly the same as that of the 8 neutrons
from 33 to 40 in Arsenic. This is with an increase of two protons from
Gallium with 31 protons to Arsenic with 33 protons.
Total Binding Energies of Nuclei
The preceding charts are examples of the incremental binding energy of adding one or more protons, and one or more neutrons to a selected nuclei / isotope.
In addition, the NIST data can be used to examine patterns in the total binding energy of atomic nuclei.
The following chart shows the total binding energy of nuclei that contain 88 nucleons (all available combinations of neutrons and protons in a nucleus where the total is 88).
The maximum binding energy is the combination of 38 protons and 50 neutrons.
This is a stable isotope of Strontium. None of the other combinations of 88 protons plus neutrons are stable. They are not found in nature.
Chart: Total binding energy of all isotopes containing 88 nucleons
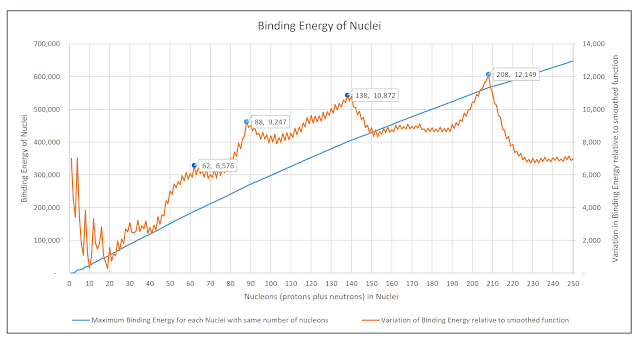
If the maximum binding energy of each isotope with a given number of nucleons is plotted, the resulting graph resembles a smoothly increasing concave function.
One of the points on the curve is for the isotope of Strontium with 88 nucleons - this is the isotope with 88 nucleons that has the maximum binding energy of all isotopes with 88 nucleons.
The following chart contains a second plot that shows the variation of maximum binding energy of all isotopes from a perfectly smooth concave function. It reveals an orderly and structured arrangement of the total binding energies of nuclei. This orderly structuring is similar to what is seen when individual nucleons are added sequentially to a nucleus, but is also in some ways independent of that pattern.
Chart: Maximum Total Binding Energies of all Nuclei with equal numbers of nucleons and Variations from a smoothed function fitted to that plot of maximum total binding energies
If the actual maximum binding energies precisely followed the smoothed function fitted to the curve then the variation between the actual binding energies and that smoothed function would be a horizontal line - as can be seen for nucleons with 230 to 250 nucleons.


