Latest Buzz...
                  

Translate

Monday, April 10, 2023

Coal Seam Gas Salt Management

The coal seam gas industry in Queensland has a problem with millions of tonnes of salts that are dissolved in water extracted from coal seams. 

In December 2018, Australian Petroleum Production & Exploration Association (APPEA) provided a report to the Queensland Department of Environment and Science titled ‘Queensland Gas: end-to-end water use, supply and management’ (the APPEA Report):

The APPEA Report gives an overview of a number of feasibility studies that have been undertaken by industry operators individually or in collaboration with other industry operators. These feasibility studies examined the viability of the identified options through a range of potential risks and impacts such as environmental, economic, safety, technical, regulatory and social factors.  

The report summarises the findings of the following options examined by the studies:

  • selective salt recovery
  • injection
  • ocean outfall
  • encapsulation.

In summary, selective salt recovery was determined infeasible due to a lack of suitable technology at a commercial scale, high upfront and lifecycle costs, significant energy consumption requirements and low excess demand in the current market.

The report makes an incorrect assumption about the option for selective salt recovery. 
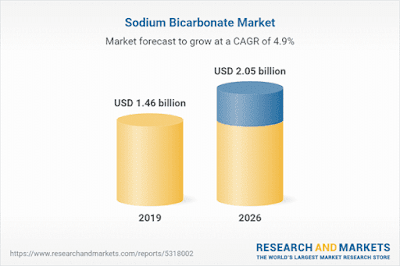
Sodium Bicarbonate Market - Forecasts from 2021 to 2026


Available Data

There are several reports on the volume of saline water and the chemicals dissolved in it are available. 

The assessment below uses the following quantities selected from reports referenced: 

  • Total water production: 2,346 gigalitres 

(See, at page 14, the University of Queensland Centre for Natural Gas (UQ-CNG) report, "Independent Review: Brine and salt management (Section 6, Queensland Gas: end-to-end water use, supply and management).

  • Composition of untreated produced waters from Australian coal basins


Alkalinity
Cl
SO4
Ca
K
Mg
Na

mg/L

1706
593
22.8
10.4
5.6
8.9
1406

(See, at Table 2, "Determining water quality requirements of coal seam gas produced water for sustainable irrigation".)

 Opportunity for Selective Salt Recovery

If the quantity for "alkalinity" is ignored for the moment, it can be seen that the total dissolved solids in coal seam gas water are almost entirely sodium and chlorine  - making up 1,999 mg per litre of the total.

The volume of produced water (2,346 gigalitres), using that estimate of 1,999 mg per litre, contain 4.69 million tonnes of sodium and chlorine (3.3 million tonnes of sodium and 1.39 million tonnes of chlorine). 

The 2018 APPEA report, and a similar report "Coal seam gas ‑ produced water and site management" in August 2014 by the Gas Industry Social and Environmental Research Alliance (GISERA), contain identical phrases describing the dissolved solids in produced water: 

"CSG water contains mainly sodium chloride (varying from 200 to more than 10,000 milligrams per litre), sodium bicarbonate [emphasis added] and traces of other compounds."
As mentioned above, if the quantity labelled "alkalinity" is ignored, the substance dissolved in produced water is, evidently, almost entirely made up of sodium chloride. That is, common table salt.

Each report on the economic viability of selective salt recovery proceeds on this basis, ignoring the quantity labelled "alkalinity", and concludes with the non sequitur that the recovery of table salt is not commercially viable. 

However...

  • Sodium carbonate (soda ash) and cooking grade sodium bicarbonate (baking soda) are commercially valuable products. 
  • The molar ratio of sodium to chlorine in table salt is 1:1. 
  • The produced water contains 1.39 million tonnes of chlorine. If this was separated with sodium to form table salt, it would use a little under 1 million tonnes of sodium. 
  • Produced water contains about 3.3 million tonnes of sodium. That is 2.3 million tonnes of sodium more than could be separated as sodium chloride. 

There is the opportunity to convert the extra 2.3 million tonnes of sodium dissolved in coal seam gas produced water into sodium bicarbonate (baking soda). 

If there is insufficient dissolved carbon dioxide (see "alkalinity", ignored previously) in the produced water to precipitate this quantity of sodium as sodium bicarbonate, the extraction plant could be used for carbon capture - dissolving an external source of carbon dioxide into the produced water - so that all of the available sodium can be extracted as food-grade sodium bicarbonate. 

The 2.3 million tonnes of dissolved sodium that is excess to the amount for dissolved sodium chloride is sufficient to manufacture 8.2 million tonnes of sodium bicarbonate or 5.2 million tonnes of sodium carbonate. 

The 2.3 million tonnes of sodium chloride dissolved in the coal seam gas produced water could be consumed by making sodium hydroxide and chlorine with it. Solar panels provide low-cost energy, and an innovative plant designed to operate economically during sunlight hours could be a useful innovation: competing with plants that were designed before solar energy costs had reduced to levels that have now been achieved. 

There is a large and expanding world market for sodium hydroxide which has uses in many industrial sectors. For instance,  sodium hydroxide is used in the purification of the bauxite prior to it being used to make aluminium.  

Allied Market Research reports 

"The global sodium hydroxide market is anticipated to develop at a momentous growth rate, accredited to growing application of the compound for industrial application."

Saturday, January 28, 2023

Patterns in binding energy of isotopes

 NIST data - "Atomic Weights and Isotopic Compositions with Relative Atomic Masses" which may be obtained by selecting the options "All Elements" and "All isotopes" - contains many patterns, some of which are more difficult to find than others. 


The following examples may reflect distinct multiples of available energy bands - analogous to the series of emission spectrum known as the Balmer series discovered for hydrogen atoms - and that were eventually explained, firstly with Bohr's model of discrete electron shells of atoms.

Pattern Recognition in large data sets
The Global Tech Council and Pattern Recognition

Analysis of some of the data made available by NIST

Isotope


Sn


Sn

Z


50


50

N


77


76

A


127


126

Relative Atomic Mass


126.910 390(11)


125.907 659(11)


Difference in relative atomic mass


1.002 731


Sn


Sn


50


50


59


58


109


108


108.911 2921(85)


107.911 8943(58)


Difference in relative atomic mass


0.999 3978


Difference between the above differences in relative atomic mass


0.003 3332


Sb


Sb


51


51


79


78


130


129


129.911 662(15)


128.909 147(23)


Difference in relative atomic mass


1.002 515


Sb


Sb


51


51


61


60


112


111


111.912 400(19)


110.913 2182(95)


Difference in relative atomic mass


0.999 1818


Difference between the above differences in relative atomic mass


0.003 3332

Repeating the above calculations for the two pairs of differences in relative atomic masses of Yttrium-98 and Yttrium-99, and of Yttrium-80 and Yttrium-81 shows the difference between those differences is 0.0066664 which is two times the figure from the calculcation above.

Repeating the above calculations for the two pairs of differences in relative atomic masses of Erbium-167 and Erbium-168, and of Holmium-165 and Holmium-165 shows the difference between those differences is 0.0016666 which is one-half the figure from the calculcation above:

Isotope


Er


Er

Z


68


68

N


99


98

A


167


166

Relative Atomic Mass


166.932 0546(22)


165.930 2995(22)


Difference in relative atomic mass


1.001 7551


Ho


Ho


67


67


98


97


165


164


164.930 3288(21)


163.930 2403(25)


Difference in relative atomic mass


1.000 0885


Difference between the above differences in relative atomic mass


0.001 6666

Sunday, January 15, 2023

Binding energy and shell structure of atomic nuclei

 An earlier post shows analysis of NIST data on the atomic masses of nuclei: "Binding Energy of Neutrons and Protons". 

The following chart uses that data to identify the shell structure of nucleons inside atomic nuclei.

The starting point is to find for each nuclide those with the combination of protons and neutrons that have the maximum binding energy. (A nuclide is a nucleus with the same total number of nucleons, no matter how many are protons and how many are neutrons.)

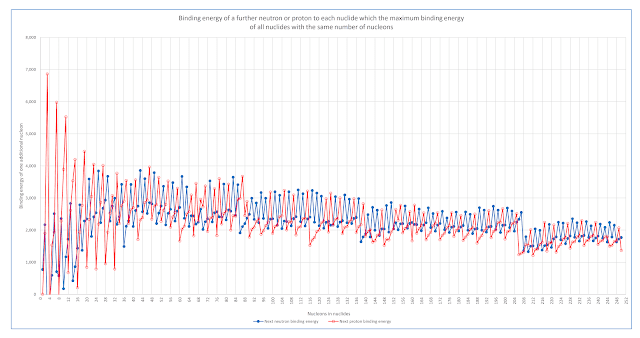
Then the binding energy of adding one further proton or one further neutron to those nuclides is calculated and displayed in the following chart. 

Binding energy of a further neutron or proton to each nuclide which the maximum binding energy of all nuclides with the same number of nucleons

Bands with decreasing binding energies are evident for nuclides with between 88 and 140 nucleons, with between 140 and 208 nucleons, and those with more than 208 nucleons.

Inspecting the specific nuclides at the transitions suggests nucleons are arranged in shells in much the way that electrons are distributed in shells around atoms...

  • The nuclide with 86 nucleons with the greatest binding energy of all nuclides with 86 nucleons is Krypton-86 which has 36 protons and 50 neutrons in its nucleus. The binding energy of a 51st neutron is markedly lower than the binding energy of all preceding neutrons. This is consistent with the "filling" of an available shell by the 50th neutron, and that further neutrons can only be bound in a shell with lower binding energies available. 
  • The nuclide with 116 nucleons with the greatest binding energy of all nuclides with 116 nucleons is Tin-116 which has 50 protons and 66 neutrons in its nucleus. The binding energy of a 51st proton is markedly lower than the binding energy of all preceding protons. This is consistent with the "filling" of an available shell by the 50th proton, and that further protons can only be bound in a shell with lower binding energies available. 
  • The nuclide with 138 nucleons with the greatest binding energy of all nuclides with 138 nucleons is Barium-138 which has 56 protons and 82 neutrons in its nucleus. The binding energy of an 83rd neutron is markedly lower than the binding energy of all preceding neutrons. This is consistent with the "filling" of an available shell by the 82nd neutron, and that further neutrons can only be bound in a shell with lower binding energies available.  
  • The nuclide with 206 nucleons with the greatest binding energy of all nuclides with 206 nucleons is Lead-206 which has 82 protons and 124 neutrons in its nucleus. The binding energy of an 83rd proton is markedly lower than the binding energy of all preceding protons. This is consistent with the "filling" of an available shell by the 82nd proton, and that further protons can only be bound in a shell with lower binding energies available. 
  • The nuclide with 208 nucleons with the greatest binding energy of all nuclides with 208 nucleons is Lead-208 which has 82 protons and 126 neutrons in its nucleus. The binding energy of a 127th neutron is markedly lower than the binding energy of all preceding neutrons. This is consistent with the "filling" of an available shell by the 126th neutron, and that further neutrons can only be bound in a shell with lower binding energies available. 

Wednesday, January 4, 2023

Binding Energy of Neutrons and Protons

 A large amount of data is now available on isotopes of all elements. 

The data includes measurements of the atomic weights of many isotopes of elements - with isotopes that contain many different numbers of neutrons for each element. 

Because nuclear binding energies of neutrons are so large - compared to electron binding energies - the difference on the atomic weights of isotopes can be used to calculate the binding energies of individual neutrons and collections of neutrons. 

For instance, typical binding energies are in the order of 9 million electron volts which is approximately 1 percent of the mass of an isolated neutron. This is equivalent to converting the mass of about 18 electrons into energy. 

For chemical reactions,  binding energies are typically in the order of just a few electron volts. 

The National Institute of Standards and Technology - NIST

The U.S. government agency NIST Physical Measurement Laboratory maintains a table of atomic weights of isotopes of all elements. 

It is available on the NIST web site page "Atomic Weights and Isotopic Compositions with Relative Atomic Masses" by selecting the options "All Elements" and "All isotopes". 

This returns a table with details for over 3,000 isotopes. 

Following are examples of 4 charts prepared by examining neutron binding energies and attempting to identify patterns. 

Each chart use a simplified binding energy scale where 1 represents 2,887 electron volts. On this scale, neutron binding energy values are typically around 3,000 of these units.

Each chart shows binding energy for individual neutrons in two different elements . These are shown on the left axis. 

Note that even-numbered neutrons have slightly higher binding energies than the odd-numbered neutrons, and the binding energy gradually declines as increasing numbers of neutrons are added while the number of protons in the nucleus is kept constant. With the addition of protons, the neutron binding energies are higher.

The sum of the binding energies of selected neutrons are shown on the right axis.


Chart 1

Binding Energies of Neutrons in Yttrium which has 39 Protons and Niobium which has 41 Protons.


Chart 1 shows that the neutron binding energies drop after the first 50 neutrons in each nucleus, and dip slightly after the first 56 neutrons.

In Yttrium, the sum of the binding energies of the 8 neutrons from 53 to 60 is exactly the same as that of the 8 neutrons from 57 to 64 in Niobium. This is with an increase of two protons from Yttrium with 39 protons to Niobium with 41 protons.

Chart 2

Binding Energies of Neutrons in Yttrium which has 39 Protons and Indium which has 49 Protons.


Chart 2 again shows that the neutron binding energies drop after the first 50 neutrons in each nucleus, and dip slightly after the first 56 neutrons in Yttrium - that has 39 protons. This dip does not appear in Indium that has 10 additional protons in its nuclei. 


In Yttrium, the sum of the binding energies of the 12 neutrons from 58 to 69 is exactly the same as that of the 6 neutrons from 58 to 63 in Indium. This is with an increase of ten protons from Yttrium with 39 protons to Indium with 49 protons.

Chart 3

Binding Energies of Neutrons in Bromine which has 35 Protons and Indium which has 49 Protons.


Chart 3 again shows that the neutron binding energies drop after the first 50 neutrons in each nucleus. 


In Bromine, the sum of the binding energies of the 20 neutrons from 38 to 57 is exactly the same as that of the 20 neutrons from 58 to 77 in Indium. This is with an increase of fourteen protons from Bromine with 35 protons to Indium with 49 protons. 

Chart 4

Binding Energies of Neutrons in Gallium which has 31 Protons and Arsenic which has 33 Protons.

 Chart 4 again shows that the neutron binding energies drop after the first 50 neutrons in each nucleus.

 
In Gallium, the sum of the binding energies of the 16 neutrons from 41 to 56 is exactly the same as that of the 8 neutrons from 33 to 40 in Arsenic. This is with an increase of two protons from Gallium with 31 protons to Arsenic with 33 protons.  


Total Binding Energies of Nuclei

 The preceding charts are examples of the incremental binding energy of adding one or more protons, and one or more neutrons to a selected nuclei / isotope. 

In addition, the NIST data can be used to examine patterns in the total binding energy of atomic nuclei. 

The following chart shows the total binding energy of nuclei that contain 88 nucleons (all available combinations of neutrons and protons in a nucleus where the total is 88). 

The maximum binding energy is the combination of 38 protons and 50 neutrons. 

This is a stable isotope of Strontium. None of the other combinations of 88 protons plus neutrons are stable. They are not found in nature. 

Chart: Total binding energy of all isotopes containing 88 nucleons

Binding energy of isotopes with 88 nucleons

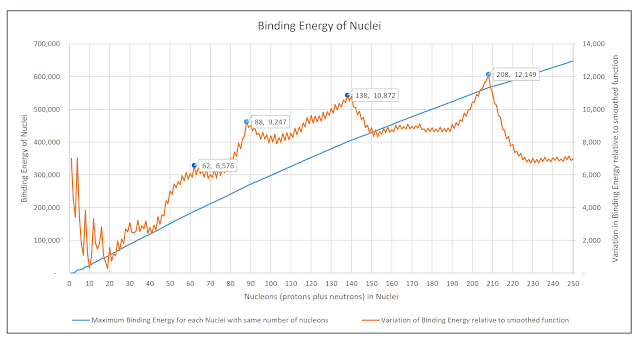
If the maximum binding energy of each isotope with a given number of nucleons is plotted, the resulting graph resembles a smoothly increasing concave function. 

One of the points on the curve is for the isotope of Strontium with 88 nucleons - this is the isotope with 88 nucleons that has the maximum binding energy of all isotopes with 88 nucleons. 

The following chart contains a second plot that shows the variation of maximum binding energy of all isotopes from a perfectly smooth concave function. It reveals an orderly and structured arrangement of the total binding energies of nuclei. This orderly structuring is similar to what is seen when individual nucleons are added sequentially to a nucleus, but is also in some ways independent of that pattern. 

Chart: Maximum Total Binding Energies of all Nuclei with equal numbers of nucleons and Variations from a smoothed function fitted to that plot of maximum total binding energies

Maximum Binding Energies of Isotopes with equal numbers of nucleons


If the actual maximum binding energies precisely followed the smoothed function fitted to the curve then the variation between the actual binding energies and that smoothed function would be a horizontal line - as can be seen for nucleons with 230 to 250 nucleons.

Sunday, November 27, 2022

Grain crops - stubble management and nitrogen fertiliser

Farmers burn crop stubble in a rice field at a village in Fatehgarh Sahib district in the northern state of Punjab, India, November 4, 2022. REUTERS/Sunil Kataria

The Victorian department of agriculture describes current Australian farm practices for stubble management in wheat cropping. A number of options are discussed. 

For example, at "Crops and horticulture - Managing stubble", 

Crop stubble is the straw and crown of plants left on the soil surface after harvest. Stubble also includes straw and chaff discharged from the harvester (header). It is also known as ‘residue’ or ‘trash’.

Stubble management is one of many complex issues that farmers must contend with. Traditionally, grain growers have burnt stubble to manage weeds, diseases and reduce biomass to make sowing easier. This is no longer the preferred option. Numerous other methods can be used to manage stubble.

Retaining stubble, rather than burning or cultivating, protects the soil from erosion. It also conserves soil moisture and organic matter to sustain crop production. This is particularly beneficial in dry areas or in dry seasons.
A new piece of information discussed by a Canadian soil scientist - that spreading plant material with a high carbon:nitrogen ratio before it has been composted - can reduce soil nitrogen. 


Old tree leaves are a staple of fall but it seems wasteful to simply throw them into the garbage. However, applying these [and wheat stubble] to your garden the wrong way can be equally as damaging to your soil nutrients. This article looks at how to use old tree leaves in your garden properly.

If it is true that the same process occurs, reducing soil nitrogen with wheat stubble retained in fields after harvesting, the result will be an increased need for nitrogen fertiliser. 

Nitrogen fertilisers are increasingly expensive, and most are made from natural gas with significant carbon dioxide emissions.  

The soil scientist's advice suggests the need for nitrogen fertiliser may be lowered by harvest wheat stubble and compost it with fungi before spreading the composted stubble on fields. 

A small-scale experiment could evaluate the potential benefit of harvesting wheat stubble instead of leaving it to compost in contact with fields, and then spreading the composted wheat stubble to return nutrients and to increase soil carbon.

Work on this possibility has been completed in India: 

The smog choking New Delhi has been linked to the burning of crop stubble. Every year, most farmers in North India clear their paddy fields by burning an estimated 23 million tonnes of straw. This year, local officials have introduced a revolutionary method in a bid to tackle air pollution. Developed by the Indian Agricultural Research Institute, the bio-decomposer mixture of fungus, jaggery [an unrefined sugar product made in Asia], gram flour and water can help break down the stubble and turn it into compost that will help fertilise the land in just two to three weeks. 


Friday, November 18, 2022

Fruit picking drones with human operators

Horticulture could benefit from automation that combines fast, repetitive actions by a robot with a human operator who provides rapid, accurate identification of fruit to be picked. 

The combination of a human operator and an automated picking machine has a number of advantages. 

A human operator would be able to pick a much larger number of pieces of fruit than either a worker or a robot alone. Fewer workers would be needed, wages could be higher because of higher productivity, and remote operation means more people would be available to pick crops. Fruit-picking could be done from the comfort of the workers' own home. 

The software could be developed as a computer game, with players identifying as many objects to be picked by a robot within the game to advance to higher levels. 

Once perfected as a game, the automated component - the fruit-picking robot - would be driven by the game-player's input just as the game-based robot was. The fruit-picking robot designer need only address the challenge of picking an identified piece of fruit after the game player has chosen it and provided the precise location. 

The video below demonstrates actions a fruit-picking robot needs to replicate - 


The game-player in the development version could control the game with a VR headset that includes eye-tracking to obtain information on the precise location and choice of pieces of fruit to be picked. 

The video below gives a description of this type of operator interface to a game or a fruit-picking robot -

A company offering VR headsets with eye tracking for computer game development, Tobii, describes its capabilities as: 

What is eye tracking in gaming?

An eye tracker gives your computer the knowledge of where you are looking on-screen. Eye tracking technology can enhance your gameplay experience by allowing you to use head and eye movements to control the in-game camera, and to affect and interact with game environments. 

VIVE Pro Eye is powered by Tobbi software


Tuesday, October 18, 2022

Flood Control - an idea out of left field

 Is it possible to siphon water through an inflatable tube? 

Siphoning water from one level to another


The town to protect - raising water level upstream and maintaining constant water level downstream


Inflatable flood barriers


Can water be siphoned through an inflatable tube?

Can the water pressure in an inflatable tube be maintained by inlet and outlet flow control vanes so that water can be siphoned through it, or will the tube invariably collapse when trying to siphon water through it?


Replacing sandbags with water-filled inflatable tubes, and using the same tubes to siphon water from upstream of a town to downstream of the town would be an improvement over filling sandbags, allowing some of a floodwater peak to be moved through the town via above ground tubes that also serve as a flood barrier.

Less back-breaking work than filling and stacking sandbags.


Sandbags in Echuca, Victoria. (ABC News: Sarah Lawrence)