Latest Buzz...
                  

Translate

Sunday, March 20, 2016

Large companies, economic growth and tax reform


ABC Radio AM
Small businesses frustrated large companies 'fiddling the system', pay no tax

Naomi Woodley reported this story on Saturday, December 19, 2015 08:10:00

NICK GRIMM: A leading small business group has taken aim at the big end of town, saying too many large companies aren't paying their fair share of tax.

The Tax Office this week released a report showing almost 600 public companies didn't pay any tax in 2013-14, including 60 per cent of those in the energy and resources sector.

The Council of Small Business says Australia has a good tax system and it accepts there are legitimate reasons why companies may not pay tax.

But the Council's chief executive, Peter Strong, has told our reporter, Naomi Woodley, that too many companies are "fiddling" the system, damaging confidence and the budget.


(Audio player added with code generated at "How to add a music player in Blogspot". Thanks Amanda.)


A novel approach to tax reform - Social Capital Royalty

The report from the Tax office summarised below shows most large corporations make little taxable income and many pay little or no tax.

They can be classified as being poor, fair and good contributors to taxable income and tax payable.

Those that are poor performers may be fiddling their books or simply are not very profitable. In either case imposing a "Social Capital Royalty" on these leaners can boost investment and economic growth.

This royalty can be avoided simply by lifting profitability and taxable income into the "fair" category. Corporations liable to pay the "Social Capital Royalty" will be motivated to change accounting practices or to invest to improve performance. Failing to do either will encourage their elimination by more innovative business competitors.

This is a relatively efficient mechanism. It provides business with motivation to improve performance rather than relying on compliance and enforcement activity by the Tax Office to weed out accounting fiddles.

The "Social Capital Royalty" should be seen as the minimum or "flag fall" liability by a corporation for the opportunity to operate a business in Australia. The amount of "Social Capital Royalty" liability by each corporation should ensure some minimum proportion, say 2% of total income, is collected by the Tax Office, firstly as tax payable with a variable royalty amount to make up any shortfall.

All of the additional revenue raised from the "Social Capital Royalty" can be distributed as a "Good Economic Performance Bonus" to corporations with taxable income of at least 5% of total income and tax payable of at least 2% of their total income.

Businesses in the "fair" category that do not have to pay any "Social Capital Royalty" can become eligible to receive a "Good Economic Performance Bonus" by investing to  lift their competitiveness and profitability.

This approach to tax reform gives an incentive to businesses that perform poorly to invest to raise productivity and profitability. It also encourages and rewards those businesses that pay their fair share of taxes.

Summary of the Tax Office report

The "Corporate tax transparency report"released in December 2015 covers 1,539 public companies that had a total income of $100 million or more in the 2013-14 financial year.
This chart provides a breakdown of the corporate transparency entities by those entities with tax payable and those without tax payable.

1,249 of the companies had a total income between $100 million and $1 billion each and the remaining 290 companies had a total income exceeding $1 billion each.

In each of these 2 groups a significant number of companies had taxable incomes between nil and 5 percent of their total income.

Of the companies with taxable incomes of more than 5 percent of their total income a significant number had a tax payable between nil and 2 percent of their total income.

The table below shows that 740 (48.1%) of the companies receive 14.0% of total income and paid just 1.6% of the tax payable by the 1,539 companies.

Only 82 (5.3%) of the companies receive 27.5% of total income and paid 68.9% of the tax payable.

Income tax information for 2013-14


Companies with Total Income from $100 million to $1 billion


Taxable Income from nil to 5% of Total Income


Nbr
Total Income
Taxable Income
Tax Payable
% of Sum of Nbr of Companies
% of Sum of Total Income
% of Sum of Tax Payable


740
227,411,885,976
2,635,600,521
627,167,780
48.1%
14.0%
1.6%


Taxable Income 5% or more of Total Income and Tax Payable from nil to 2% of Total Income


Nbr
Total Income
Taxable Income
Tax Payable
% of Sum of Nbr of Companies
% of Sum of Total Income
% of Sum of Tax Payable


154
50,309,170,667
4,861,416,908
599,193,549
10.0%
3.1%
1.5%


Taxable Income 5% or more of Total Income and Tax Payable 2% or more of Total Income


Nbr
Total Income
Taxable Income
Tax Payable
% of Sum of Nbr of Companies
% of Sum of Total Income
% of Sum of Tax Payable


355
105,485,898,123
19,323,412,036
5,167,853,388
23.1%
6.5%
13.0%


Sum of Companies with Total Income from $100 million to $1 billion


Nbr
Total Income
Taxable Income
Tax Payable
% of Sum of Nbr of Companies
% of Sum of Total Income
% of Sum of Tax Payable


1249
383,206,954,766
26,820,429,465
6,394,214,717
81.2%
23.5%
16.0%


Companies with Total Income of $1 billion or more


Taxable Income from nil to 5% of Total Income


Nbr
Total Income
Taxable Income
Tax Payable
% of Sum of Nbr of Companies
% of Sum of Total Income
% of Sum of Tax Payable


159
479,744,441,621
7,271,212,018
1,388,426,103
10.3%
29.4%
3.5%


Taxable Income 5% or more of Total Income and Tax Payable from nil to 2% of Total Income


Nbr
Total Income
Taxable Income
Tax Payable
% of Sum of Nbr of Companies
% of Sum of Total Income
% of Sum of Tax Payable


49
317,549,625,271
34,371,492,696
4,621,252,061
3.2%
19.5%
11.6%


Taxable Income 5% or more of Total Income and Tax Payable 2% or more of Total Income


Nbr
Total Income
Taxable Income
Tax Payable
% of Sum of Nbr of Companies
% of Sum of Total Income
% of Sum of Tax Payable


82
448,522,165,053
101,443,717,535
27,458,923,189
5.3%
27.5%
68.9%


Sum of Companies with Total Income of $1 billion or more


Nbr
Total Income
Taxable Income
Tax Payable
% of Sum of Nbr of Companies
% of Sum of Total Income
% of Sum of Tax Payable


290
1,245,816,231,945
143,086,422,249
33,468,601,353
18.8%
76.5%
84.0%

Sum of All Companies above


Nbr
Total Income
Taxable Income
Tax Payable
% of Sum of Nbr of Companies
% of Sum of Total Income
% of Sum of Tax Payable


1539
1,629,023,186,711
169,906,851,714
39,862,816,070
100.0%
100.0%
100.0%

Sunday, February 14, 2016

Optimising the price-performance ratio of solar thermal power stations

Optimising the price-performance ratio of concentrated solar thermal power stations is an interesting mathematics puzzle.

Fossil fuel power stations have traditionally been designed without the benefit of advanced compressor technology that achieves close to isothermal compression. Without this technology all designs necessarily aim to maximise the temperature at which fossil fuels are burned.

Optimising the price-performance of concentrated solar thermal power stations has two significant differences:
  1. New compressor technology allows optimisation without the need for extremely high temperatures and substantial waste heat being discharged as a result.
  2. Solar thermal energy able to be used in a solar thermal tower reduces as the temperature increases. At the maximum attainable temperature known as the "stall temperature" energy arriving in the collector is being re-radiated into space at the same rate as it arrives. No energy is available to be converted to electricity.
As a result of the last point above, an increase in efficiency that relies on a higher temperature will eventually result in less electricity being produced because less solar energy is being converted - even though the efficiency of conversion is greater. For instance 50 percent of 100 kilojoules is more than 75 percent of 60 kilojoules in the situation where 40 kilojoules are lost due to a higher temperature in the solar receiver.


This video describes the difference between steam turbine power plants and gas turbine power plants. Concentrated solar thermal power plants use the same technology without using fossil fuels as the source of thermal energy.


Steam power plants and compressed air turbines can only convert about 35% of the energy collected into electricity:
  • On the back end of the steam turbine the steam must be condensed back into water.  During this condensation process, heat is “rejected” up cooling towers and into the atmosphere, resulting in a loss of 30% to 40% of the original heat energy supplied to the system. More energy is then used in pumping the condensed water back into the boiler at very high pressure.

  • Compressed air turbines discard a large amount of energy collected in the exhaust flow out of turbine. More energy is used by the axial flow compressor that compresses air on input to the turbine. 
"Solutions" focus on methods to make use of the heat energy wasted by these engines. One often-used approach is to build an entire steam power station behind a compressed air turbine generator! This "solution" is known as a combined-cycle gas turbine or "CCGT" power plant.

For reasons that are not clear solutions that simply avoid the waste of thermal energy in the first place are overlooked.

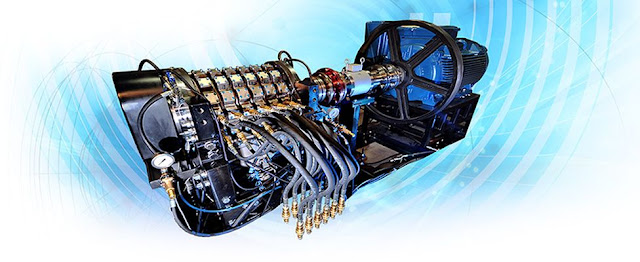
Adding a high-efficiency compressor to the front of a conventional axial-flow air compressor and turbine generator allows the exhaust to cool to ambient temperature with no heat energy wasted.

Hicor technology achieves a more efficient compression process
Hicor’s technology achieves a more efficient compression process by minimizing the temperature rise


Compression Basics

Compression Basics
The Hicor technology achieves a more efficient compression process by minimizing the temperature rise associated with compression, improving efficiencies over conventional compressors by 30% or more.
At its most basic, compression is a mechanism by which work is put into a fluid and results in an increase in pressure. Heat is also generated as a by-product of compression, which serves to make the process less efficient by turning some of the input work into heat instead of pressure. As the gas being compressed heats up further and further, the compression process gets less and less efficient.

Hicor’s technology achieves a more efficient compression process by minimizing the temperature rise associated with compression, improving efficiencies over conventional compressors by 30% or more.

Hicor’s proprietary compression technology provides a myriad of additional benefits as well, including fewer moving parts, less vibration and noise, and a variable pressure ratio. Finally, Hicor’s near-isothermal compression technology allows for compression ratios of 30 to 1 or higher, reducing system level complexity and resulting in lower capital and operating costs.

Positive Displacement Compression

The compression process can be displayed graphically, as in the pressure-volume (PV) plot shown below. The curves in a PV plot show how the pressure increases as volume decreases. For different compression processes, the curves will vary. The work of compression can be visualized as the area under the curve corresponding to a given compression curve.
graph
All compression processes fall between two extremes: adiabatic, where no heat is exchanged with the outside environment and the energy put into the system remains internal; and isothermal, where energy is removed from the system in the form of heat and the temperature of the gas remains constant.

In practice, all compression processes fall somewhere between adiabatic and isothermal and are known as polytropic processes. To achieve a more highly efficient compression process, it is ideal to reduce the polytropic constant to as close to the isothermal process as possible, where the polytropic constant is 1.

The Hicor proprietary compressor design is capable of achieving polytropic constants as low as 1.06, improving efficiencies over conventional, near-adiabatic compressors by as much as forty percent.


Saturday, February 6, 2016

Would you be surprised if one day energy was free?

Part 1 - Canberra August, 2004

"I've always been really interested in recreating space phenomenon in the laboratory. It's very difficult to measure in space to measure the aurora although it is a true wonder in seeing these lights in the sky. But to simulate this in the laboratory, to do experiments on it and then try and understand what is happening I think for me is one of the greatest joys that we've been given", said Dr Rod Boswell.

Aurora - atmospheric plasma

First you make the plasma by zapping a gas with radio waves - "microwaving" it. The atoms change into electrically charged particles called ions. Cut the end of the tube and the ions all shoot out, creating thrust - plasma thrust.

"This is Wombat. It's called wombat because it's got four legs and sort of looks like a wombat. You can see here we create a plasma, this is the glowing gas you can see in the end there. So the plasma's created here then moves into space. And if you look in there, ah, it always amazes me. There's this blue column of plasma which is shooting out from the plasma source," Rod explained.

Wombat - plasma generator research device

Rod made quite an impression around the world with his Wombat plasma generator. NASA took some of his ideas to design tiny satellite guidance thrusters.

Anxious to find new ways to make plasma thrusters work better, Rod assembled a team of young physicists, and encouraged an atmosphere of ideas and creative thought.

"I came here to ANU because I thought that this is one of the top laboratories in the world. The environment is just perfect and it's really good for creativity," explained Dr Christine Charles.

Professor Christine Charles
Head of the Space Plasma, Power and Propulsion Laboratory
Australian National University
Christine, freshly arrived from France, soon became inspired by Rod's enthusiasm for plasmas, and for the forces in the universe that generate them.

Rod had recently commissioned a new, improved version of wombat, and Christine was eager to try it out, to see if she could, amongst other things, recreate an aurora in the lab. One day, impatient for results, Christine decided to play with the settings. She was amazed with what happened next.

"I'll show you. Normally this is standard plasma, but on the day, instead of doing what everyone does which is turn the knob on, turn the power on, and see what happens, I did the opposite. I turned the power down and I reduced the flow down. So then you need to increase the magnetic field to be able to contain it. So you do that, you make the measurements with the ions... Look at this, there it is. The hot ions, the plasma is suddenly accelerating, all by itself. It appeared to be in free fall, travelling much faster then I'd ever seen before. And I kept getting this result, and I thought, oh, this is like, oh! What's happening!" Christine recalled.

"The plasma behaves like water tumbling over a cliff, getting faster as it drops. And, just like an aurora, it seems that the plasma actually makes the 'cliff' - all by itself. It's almost magic."

"What Christine found is that under certain conditions instead of just flowing out smoothly it creates this jump, and the ions fall down this, and it's like having two electrodes that accelerate the ions like in an accelerator, but there are no electrodes! The plasma itself forms an acceleration mechanism. It's actually a wonder," said Rod.

Tuesday, February 2, 2016

Battery storage of renewable energy

You can increase the financial return from an investment in a lithium ion battery pack by your choice of where to use the energy it stores.

For instance if the retail price of electricity is 20 cents per kilowatt-hour then using stored solar energy to replace the purchase of electricity you use in your home will save you 20 cents for each kilowatt-hour your battery pack delivers.

Tesla’s new “Powerwall” home battery will cost $3,500 for 10kWh units


If you chose to pay for the lithium ion battery pack to be built into an electric vehicle then the financial return may be far greater:

  • Suppose a small electric vehicle can be fully charged in 7 hours at the rate of 2.4 kilowatts per hour and travel about 150 kilometres on that charge.
  • The total amount of energy stored is 7 hours times 2.4 kilowatts which is 16.8 kilowatt-hours for 150 kilometres, or 11.2 kilowatt-hours for each 100 kilometres.
  • Suppose a similar small petrol car would use 10 litres of petrol per 100 kilometres costing about $1 per litre. At this price of petrol the fuel cost is 10 litres times $1 per 100 kilometres which is $10.
  • Choosing to put your lithium ion battery pack investment in a small car could save you $10 for each 11.2 kilowatt-hours of energy stored in it. 

This is a saving of $0.89 per kilowatt-hour which is more than 4 times the saving of $0.20 per kilowatt-hour if you use the lithium ion battery pack to replace electricity you use in your home.

Wednesday, January 27, 2016

Battery Storage and Appliances - more value for your dollar

Household battery storage and more efficient appliances: making your dollars go further

"You may be able to lower the purchase cost and make more savings by replacing some older appliances when purchasing a battery storage system." A 2 kilowatt oil-filled column heater is a cheap and popular method of heating in many Australian homes. They retail for between $50 to $380 (see: Choice "Electric heater buyer guide")

A similar amount of heating can be produced by a small energy efficient reverse cycle inverter air conditioner such as the Mitsubishi 2.0Kw Cooling/2.5Kw Heating. (see: Energy Rating Website "Air Conditioners - AS/NZS 3823.2")

The question of how to make your dollars go further arises because:
  1. The small energy efficient air conditioner retails for around $800 and requires a licenced electrician to do the installation. 
  2. The cheaper oil-filled column heater uses 2,000 watts of electric energy during heating cycles.
  3. The more energy efficient air conditioner uses only 450 watts  during heating cycles and provides 25 percent more heat with that electricity.
So, which is better value:
  • The cheaper electric heater with battery storage to operate it for, say, 5 hours - that is 5 times 2,000 watts which is 10 kilowatt-hours of available battery energy storage, or
  • The more expensive and more efficient air conditioner that can operate for 5 hours with just 5 times 450 watts which is just 2.25 kilowatt-hours of available battery energy storage.
The answer will depend on the cost per kilowatt-hour of battery storage.

When buying battery storage for your home systems don't forget to check on the availability and price of more energy-efficient appliances. You may be able to lower the purchase cost and make more savings by replacing some older appliances at same time. 

An air conditioner for heating costs just 20 percent of the cost of running an electric heater

Bad news stories of air conditioners driving up peak electricity demand during heat waves abound.

The good news is that using an air conditioner to heat your home in winter uses only 20 percent of the electrical energy of an electric heater.

So if you are using electric heaters to keep warm and are concerned about your electricity bill - there is an alternative available that will cut that heating bill by 80 percent.

These two diagrams illustrate why air-conditioners are so much cheaper to run than electric heaters.

The performance of air conditioner systems for heating is available at the Air Conditioner Energy Ratings government website.
Reverse Cycle Air Conditioner - energy flow
(Pay for 1 kilowatt-hour, get an extra 4 kilowatt-hours free)

Electric Heating - energy flow

Interesting implications on fuel costs


The Wildcard Of Renewable Energy
By News Staff | August 13th 2012
"If you produce only heat from woodchips you have an energy efficiency of more than 80 percent"
The same can be said of burning wood pellets, natural gas, heating oil or any other fuel to heat your home. It looks like a good proposition - obtaining more than 80 percent of the energy content of the fuel as useful heat.

It is not the best that can be done however. If the heat energy in the fuel is converted to electrical energy at 50 percent efficiency then each 1 kilowatt-hour of heat energy can produce 1/2 kilowatt-hour of electrical energy. If this is used in a reverse-cycle air conditioner to heat your home, you obtain 5 times 1/2 kilowatt-hour (that is 2 1/2 kilowatt-hours) of heat energy for each 1 kilowatt-hour of heat energy in the fuel.

Burning high-quality fuels such as natural gas for heating is an unnecessary waste of energy resources.

Monday, January 18, 2016

Power stations, Engines, Air Conditioners Fuels Cells, Batteries and more

Innovative design can be spurred by scientific understanding of energy storage and transformation.

This diagram represents current scientific understanding of how energy may be stored and transformed.
Power stations, Engines, Air Conditioners Fuels Cells, Batteries and more

A power station can theoretically convert 10,000 joules of thermal energy at 1200 degrees Kelvin into 7,500 joules of electrical energy and 2,500 joules of thermal energy at 300 degrees Kelvin.

It is also theoretically possible to decompose some chemical compound into its constituent elements with 10,000 joules of thermal energy at 1200 degrees Kelvin and produce 7,500 joules of electrical energy and 2,500 joules of thermal energy at 300 degrees Kelvin in a fuel cell that recombines those elements into the original chemical compound.

If it is cheaper and more reliable to construct a machine that operates at a temperature of just 900 degrees Kelvin instead of 1200 degrees Kelvin, then this machine could theoretically decompose the chemical compound into its constituent elements with 2,500 joules of electrical energy and 7,500 joules of thermal energy at 900 degrees Kelvin.

It is not necessary to view batteries as the only type of device that can store electrical energy:
At some later time the decomposed elements could be used to produce 7,500 joules of electrical energy and 2,500 joules of thermal energy at 300 degrees Kelvin in a fuel cell that recombines those elements into the original chemical compound.
The graph above is a representation of scientific knowledge from which these observations can be made.

Mathematics permits this simple geometric model to be created from three separate scientific models:
  • Carnot's equation for efficiency of heat engines.
  • Nernst's equation for electrochemical reactions.
  • Gibbs-Helmholtz's equation for chemical reactions.