Latest Buzz...
                  

Translate

Saturday, June 23, 2018

National Energy Guarantee and known pitfalls

A Japanese study released in October 2017 warns of costly European policy mistakes when investment in renewable energy is increasing.

Though details of the National Energy Guarantee policy are still under discussion, the Japanese study is worth checking so that Australia doesn't fall into any of the pitfalls it warns of.

This is an extract with some of the warnings in the Japanese study.


The Ways Forward for Japan EPCOs in the New Energy Paradigm
October 2017
Renewable Energy Institute, The Ways Forward for Japan EPCOs in the New Energy Paradigm (Tokyo: REI, 2017), 76 pp.
…
Executive Summary
…
Japan electric power companies(EPCOs) have essentially been focusing on their domestic market so far. Yet, business opportunities also exist overseas. ... Critical to successful internationalization of Japan EPCOs business will be their ability to deploy cost efficient Renewable Energy (RE).
To make their way through this new energy paradigm, Japan EPCOs have the chance to learn critical lessons from their European peers.
European EPCOs have already faced similar challenges to those Japan EPCOs are now confronted with. And European EPCOs have failed to adapt quickly. Japan is lagging behind, and that is not necessarily a bad thing. Indeed, it means that Japan EPCOs may benefit from their European peers painful experiences.
Struggling, several European EPCOs posted record losses and saw their market capitalization collapse in recent years. They were victims of low wholesale electricity prices resulting from sluggish electricity demand and dramatic expansion of wind and solar power with lower marginal cost, leading to overcapacity and pushing fossil power plants out in the competitive market merit order. (page 1)
…
Key Challenges Faced by Japan’s EPCOs
Global Annual Change in Electricity Generation 2010-2016
In the past two years RE accounted for the majority of new power capacity globally driven by dramatic cost reductions in wind and solar, and globally for the past three years the increase in RE electricity generation has been higher than the increase in fossil electricity generation. (Page 15)
…
European EPCOs Failed to Adapt Quickly
These overall negative performances result from the European EPCOs failure to quickly adapt to the energy transition, at the generation level especially. While electricity consumption stagnated, significant expansion of close to zero marginal cost wind and solar power, in which European EPCOs did not sufficiently invest, took place in Europe. The latter helped lowering wholesale electricity prices due to the merit order effect. At the same time, conventional power capacity did not significantly decrease which combined with stagnating electricity consumption and the expansion of RE resulted in overcapacity further reducing wholesale electricity prices (Chart 31). European EPCOs conventional power plants were thus outcompeted due to their higher marginal costs and suffered from low wholesale electricity prices, thus significantly affecting European EPCOs profitability. (page 26-27)
…
In Europe, several EU Member States including France, Germany, Italy, Spain, and the UK, notably, have introduced rewards for making capacity available, in the form of capacity mechanisms. However, capacity mechanisms are considered problematic because they risk distorting electricity markets. Inappropriate designs of mechanisms may for instance result in existing uneconomic power plants receiving financial support and disturbing the transition to a low-carbon economy – a failure. 31  The UK and Germany offer telling examples of far from perfect capacity mechanisms. (page 28)
…
In Germany, from this year 2.7GW of largely inflexible and high-emitting lignite capacity will be placed into an emergency stand-by reserve, only to be used as back-up when required for a period of four years, after which these plants will be permanently retired. 33  This comes at an estimated cost of €1.6 billion to the German government to compensate for lost revenues from the electricity market during these years of security stand-by. 34
These flawed designs are unsurprising insofar as it has been found that many of EU Member States did not adequately assess the need or cost-effectiveness before introducing such mechanisms. 35
In addition, it has also been recognized that capacity mechanisms implementation must be accompanied by appropriate market reforms. 36
Thus, before adding gigawatts of new conventional power plants and/or pushing for the implementation of a capacity mechanism in Japan, Japan EPCOs should thus be well aware of these painful lessons learnt in Europe (page 29)
ENDNOTES
31   European Parliament, “Capacity mechanisms for electricity – May 2017” (accessed 28 August 2017)  
33   The Economist Intelligence Unit, “Is Germany’s Energiewende cutting GHG emissions? – 20 March 2017” (accessed 31 August 2017)
34   Overseas Development Institute, Rethinking Power Markets: Capacity mechanisms and decarbonisation (London, United Kingdom: ODI, 2016), 46 pp
35   European Parliament, op. cit. note 31
36   Ibid.

Friday, June 15, 2018

Electric vehicles make solar power mobile

Solar PV systems can reduce electricity bills for many families and businesses.

Unfortunately this isn't the case for families who rent because properties available for rent rarely have solar panels installed.

Even for families who do have solar PV systems, the savings aren't that great when everyone is at work or school during the the day when the sun is shining and the solar energy output is mostly being fed into the grid.

There is another way to supply solar energy to these households and help them cut their electricity bills.

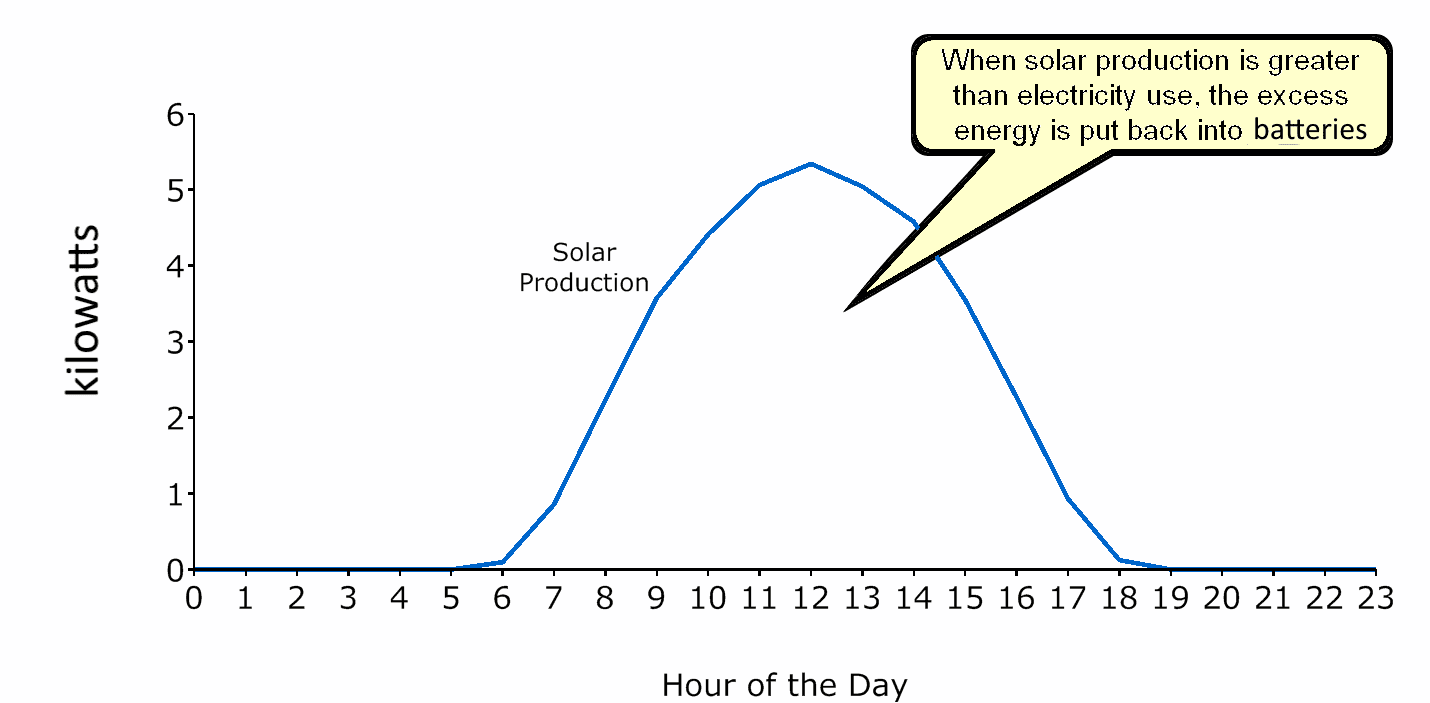
Many businesses are saving on their power bills by installing solar panels, but the savings would be greater if they had batteries to provide power early in the day and late in the afternoon when the output of the solar system is below the midday peak output.

Solar PV system output varies during the day
Suppose a business with a solar PV sysytem buys 4 or 5 electric vehicles that can deliver electricity from their batteries - the Nissan Leaf with a 40 kilowatt-hour battery is one electric vehicle designed for this role -  and leases them to its workers to be used in the following way:
  • The worker drives the electric vehicle to work each morning and plugs it into a power exchange socket where it provides electricity to the business whenever electricity use is greater than the output of the solar PV system AND has its battery recharged whenever there is excess solar energy being produced. 
  • The worker drives the car home each day after work and plugs it into a power exchange socket where it powers the home - with solar energy stored during the day while at work - during the evening peak period when electricity prices are at their greatest. 
  • By late evening or early morning, if the car battery charge has fallen below the level that is needed for the morning peak period to prepare breakfast and for the commute to work, some additional energy from the grid is stored in the battery - again at off-peak rates.
  • ...and so on, each day.
This may make electric vehicles a better investment than just assessing their value as a replacement for a simple petrol-fueled vehicle. They can provide electricity as backup generators for businesses when solar energy output is less than the amount of electricity used and they can let workers take solar energy home. This is especially valuable for anyone who lives in rented accommodation and/or lives in one of the many households where all the members are away from the home during daytime.

The following video uploaded in 2013 describes the process in 2 minutes. At that time, the Nissan Leaf had only a 24 kilowatt-hour battery. The recently released model has a 40 kilowatt-hour battery. 


One application of the technology is described in Adam Vaughan's the article published in The Guardian on October 3, 2017:

Electric car owners 'can drive for free by letting energy firms use battery' 

Electric car owners will be paid for letting an energy company use their vehicle’s battery in a pioneering scheme to increase take-up of the cleaner vehicles and help power grids manage the growth in green energy.

Nissan and one of the UK’s biggest challenger energy suppliers, Ovo, will offer the “vehicle-to-grid” service to buyers of the Japanese carmaker’s new Leaf from next year.

After installing a special charger in a customer’s home, the supplier will take over the management of the car’s battery, with owners able to set a minimum amount of charge they want for driving the next day. Ovo will then automatically trade electricity from the battery, topping it up during off-peak periods when power costs about 4p per kilowatt hour (kWh), and selling it at peak times for about four times as much.


Thursday, June 7, 2018

Australian Government Minister unaware of ratification of Paris Agreement

In September 2017 Steven Ciobo, the Australian Minister for Trade, Tourism and Investment made a decision to allow taxpayer funding of coal projects.


After this decision became known he was asked on 6 June 2018 to give reasons for it.

The reasons reveal the loss of capacity of the Coalition Government to obtain economic intelligence needed for policy decisions.

Steven Ciobo mistakenly believed (his answer to the question is shown in full below) that decisions by a number of banks and others to not invest in thermal coal mines was a consequence of social pressure rather than economic pressure.

Australian banks have made climate-related investment policies for coal projects in the interests of their shareholders following from the Australian Government's ratification of the Paris Agreement. (See "Ratification of the Paris Agreement on Climate Change") This ratification was made on 10 November 2016:
The Australian Government today reaffirmed Australia’s strong commitment to effective global action on climate change with the ratification of both the Paris Agreement on climate change and the Doha Amendment to the Kyoto Protocol.
Further information on the Government's commitment to the Paris Agreement describes "key outcomes" for coordinated global action including:
A global goal to hold average temperature increase to well below 2°C and pursue efforts to keep warming below 1.5°C above pre-industrial levels.
This "coordinated global action" has a number of economic impacts and it is these that underpin decisions by banks to reduce investment in thermal coal projects - NOT "social pressure" as Steven Ciobo mistakenly believes.

The economic intelligence he should have been across includes the material produced by the International Energy Agency following the Paris Agreement. Note that the announcement by the Westpac bank to which Steven Ciobo took umbrage is made with this material clearly in mind:
Global coal demand and share of coal in world energy demand by scenario

Westpac launched its updated Climate Change Action Plan on 28 April 2017. It said:
"the International Energy Association’s (IEA) modelling indicates that under a two degree scenario thermal coal demand will peak in the current decade and decline thereafter."
The economic pressures that result from global action are being felt beyond Australia. The Turnbull Government is poorly advised in deciding to risk taxpayer funds in a futile last-stand against change:
Over 18,000 jobs cut in industries building thermal power plants

Minister for Trade, Tourism and Investment

The Hon Steven Ciobo MP

National Press Club interview

6 June 2018
QUESTION: Amy Remeikis from The Guardian. Just to come back home for a moment, last year you reversed the Efic decision to allow for onshore resource investment. I'm just wondering what is the rationale behind that decision given that major Australian financial institutions have been pulling away from that sort of investment since 2015, and if you didn't consult with your department, who did you get advice from, if at all?
STEVEN CIOBO: Sure. Well, the rationale for it was because the decision by a number of banks and others to not invest was a consequence of social pressure rather than economic pressure. And the reason I can say that is because, contrary to The Guardian's claims and reporting, I did actually obtain advice. In fact, my decision to alter the statement of expectations for Efic went through Cabinet. And of course by definition I received advice from the department in relation to it, and they, in fact, highlighted it was a consequence of social pressure rather than economic decision-making that led to that. So that's the reason why we made the change. Because in essence it is obviously preposterous to deny viable resource projects - completely separate to the issue of coal - from securing financing for export, which creates livelihoods, drives, in many respects, rural or urban economies. I think Australia owes it to our people to do everything we can to provide and uphold their standard of living.


Wednesday, May 30, 2018

Coal industry wild optimism failed


The Australian Government's "Coal" information in 2018 produced in 2011

The information below was on an Australian Government web site on 30 May 2018: "Department of Industry, Innovation and Science - Resources"

It shows "forecasts" of coal exports for the years 2011/12 to 2016/17. It was evidently created in 2011 and has never been updated.

The wildly optimistic "forecast" of thermal coal exports for 2016/17 - 267.9 million tonnes - is 25 per cent above the actual amount that was exported in 2016/17 - just 201.7 million tonnes.

Forecasts of thermal coal production were even more fantastic. In 2016/17 Australian coal mines were to produce 332.9 million tonnes when the actual figure was only 250.0 million tonnes.

If the excess of thermal coal produced over exports is assumed to be domestic consumption, then the "forecast" domestic consumption for 2016/17 is shown as 65.0 million tonnes. The actual figure was only 48.3 million tonnes.

The Federal Government talks up the prospects of new thermal coal mines in Australia, seemingly encouraged by out-dated and unrealistic forecasts created in the distant past.

Running blind

Cutting numbers of staff in the Department of Energy has left the Australian Government in a position of not knowing which way is up. Its Ministers promote investment in declining industries as a result of being under the spell of wildly optimistic, wrong forecasts.

Leaving wrong forecasts available on Government web sites is not without consequences. It invites costly investment decisions to be made by mistake across the entire economy -


Coal

Coal is a fossil fuel accounting for around 40 per cent of total world power generation.1 Coal is primarily a mixture of carbon and hydrogen atoms, with very small amounts of sulphur (bound with carbon or iron) and other elements.
Australia provides around 30 per cent of the world coal trade.
In 2011, Australia was the world's largest exporter of metallurgical coal and the second largest exporter of thermal coal. Australia is also the fourth largest producer, and has the fifth largest resources of black coal in the world.
Australia's accessible economic demonstrated resources are sufficient to sustain current black coal production rates for nearly 100 years.2 Brown coal accessible economic resources are estimated to be able to sustain current brown coal production for over 500 years.2
Coal is Australia's largest energy export earner. In 2010–11, Australia exported 283 million tonnes (Mt) of metallurgical and thermal coal to world markets worth A$43.7 billion. Total coal (black, saleable) production in Australia in 2010–11 is estimated to have been 345 Mt. Over the medium term, total Australian metallurgical and thermal coal exports are forecast to increase by nearly 72 per cent: from 283 Mt in 2010–11 to 486 Mt, valued at $56.5 billion, in 2016–17.
The majority of Australia's metallurgical and thermal coal exports were exported to the Asian region in 2011. This leading position has grown over many years of coal trade, based on the quality of Australian coal resources and the ability of Australian industry to meet and respond to the needs of its customers.
In 2011, Australia's top four export markets for metallurgical coal were Japan (40.8 Mt), India (28.9 Mt), Republic of Korea (16.5 Mt) and China (13.7 Mt). Australia's top four export markets for thermal coal were Japan (65.4 Mt), the Republic of Korea (29.5 Mt), China (19.9) and Taiwan (19.1 Mt).
Australian brown coal (lignite) production, mainly from the Latrobe Valley in Victoria, was 68.75 Mt in 2009–10. Brown coal is used domestically in electricity production. Coal, both black and brown, accounted for over 75 per cent of Australian electricity generation in 2009–10.

Australian coal production and exports

Production

Australian
financial years
2008–092009–102010–112011–12 (f)2012–13 (f)2013–14 (f)2014–15 (f)2015–16 (f)2016–17 (f)
Thermal coal209.7198.3206.1224.8238.2271.6290.2319.0332.9
Metallurgical coal130.0163.0146.0152.0169.0180.0195.0213.0222.0

Exports

Australian
financial years
2008–092009–102010–112011–12 (f)2012–13 (f)2013–14 (f)2014–15 (f)2015–16 (f)2016–17 (f)
Thermal coal136.4135.0143.3162.6173.1206.6225.2254.0267.9
Metallurgical coal125.0157.0140.0148.0166.0176.0191.0209.0218.0
Total261.4292.0283.3310.6339.1382.6416.2463.0485.9

Export Value (A$m, nominal)

Australian
financial years
2008–092009–102010–112011–12 (f)2012–13 (f)2013–14 (f)2014–15 (f)2015–16 (f)2016–17 (f)
Thermal coal17 88511 88613 95617 84617 64119 94320 39021 63521 604
Metallurgical coal36 81324 52629 79331 09430 12233 32134 75734 75434 932
Total54 69836 41243 74948 94047 76353 26455 14756 38956 536
Source: ABARE Australian Commodities March Quarter 2010 and BREE Resources and Energy Quarterly March quarter 2012. (f) forecast.
1IEA's Paper on Power Generation from Coal 2011—Ongoing Developments and Outlook
2Based on 2010 rate of production.

Sunday, April 22, 2018

Food drying with renewable energy

Increases in energy costs are a signal for industry to audit its energy use and survey new plant that lowers energy use.

The food processing industry in Victoria has received quotes for natural gas with prices more than doubling in just a few years.
Echuca-based food processor Kagome expects to pay $3.6 million for gas this year, up from $2.4 million last year, despite plans to use less gas. Kagome employs more than 200 people. 
Natural gas is the dominant form of energy use for the food processing plant at KAGOME Australia
Kagome Australia's processing plant receives about 4,000 tonnes of tomatoes each day during the harvest period of 70 days. Natural gas is used to evaporate water from the tomatoes for the production of tomato paste.

Evaporating 1,000 tonnes of water from 4,000 tonnes of tomatoes each day can use an enormous amount of energy. This isn't necessary but it depends on how it is done.

One way to evaporate 1,000 tonnes of water that does use an enormous amount of energy is to simply put batches into large cauldrons with gas burners beneath them. Allow the tomatoes in the cauldrons to simmer until the desired volume of water has evaporated.

This way requires 2,257 gigajoules of thermal energy that converts 1,000 tonnes of water into steam. If this heat energy is supplied by natural gas costing $9 per gigajoule, the daily energy bill would be about $20,000 and the total bill over the tomato harvest period of 70 days woul be about $1.4 million.

There are several other ways to perform the same process using much less energy.

For instance, the energy needed to convert 1 kilogram of water into water vapour is 2,257 kilojoules. The same amount of energy can be recovered when that kilogram of water vapour is condensed back into water.
Mechanical Vapour Recompression (MVR)

The mechanical vapour compressor uses a very small amount of electrical energy to transfer a very large quantity of heat energy from the condensing steam back into the cauldron of tomatoes where it boils off an identical amount of water.
The cost saving of this method is all of the natural gas used in the inefficient method of converting 1,000 tonnes of water into water vapour. This method also produces distilled water while continually recycling the latent heat of evaporation in the water vapour as it condenses back into water.

The condensed water produced may have some value too as a pure, distilled by-product.

Equipment using this method is commercially available. One type is marketed as "forced circulation evaporators". These are for concentrating fruit paste (tomato paste, peach paste, apricot paste and etc.) and some other products with high viscosity. Another type is marketed as "falling film evaporators". These are for concentrating products with low viscosity, for example: fruit juice, milk etc.

The value of the energy savings may make it worthwhile for Kagome Australia to invest in a forced circulation evaporator and eliminate the need for natural gas.


Thursday, April 5, 2018

Value for investment dollars - Snowy Hydro vs Plasma Gasifiers

The Snowy Hydro 2.0 project is one possible way to store renewable energy.
For each 100 megawatt-hours of electricity stored about 70 megawatt-hours is likely to be generated and delivered to consumers - after allowing for pumping, generation and distribution losses.

If the wholesale price of electricity is $70 per megawatt-hour, each 100 megawatt-hours to storage will cost $7,000. The amount available for delivery - 70 megawatt-hours - will thus cost $100 per megawatt-hour. (That is $7,000 for the 100 megawatt-hours of electricity stored divided by the 70 megawatt-hours delivered to consumers.)

The result is a 40 percent increase in the wholesale price of electricity.
If the purpose is to lower the price of electricity, Snowy Hydro 2.0 project isn't looking too good on this part of the assessment.

The next step is to consider the cost of constructing the scheme, and the need to pay interest to the investors on the amount. This is another problem for the goal of reducing the price of electricity. It is aggravated by the fact that the project lead time means that interest costs accumulate for many years before there is any opportunity to begin recovering those costs from electricity consumers.

Another possible of way of storing renewable energy is to run plasma gasification units with electricity to be stored, converting waste that would otherwise go to landfill into synthesis gas.
Westinghouse Plasma Gasification
Converting Waste Into Clean Energy for a Healthier Planet

These plants are able to deliver over double the amount of energy that is used to operate them.
For each 100 megawatt-hours of electricity costing $7,000 stored in synthesis gas, at least 200 megawatt-hours is available for delivery to consumers - reducing the wholesale price of electricity to $35 per megawatt-hour - a reduction of 50 percent in this stage of the analysis.

Unlike Snowy Hydro 2.0, the assessment of value for investment dollars gets better, not worse, in the next phase. The elimination of waste heading to landfill represents a further cost-saving for investors.

That plasma gasification units can be built quickly means the return on investment begins far sooner than is possible for Snowy Hydro 2.0.

Related post - Efficient renewable energy storage, waste recycling and zero fossil fuels

Tuesday, April 3, 2018

Robots go faster with Interrupt Service Routines


Example of an Arduino Uno sketch that uses an interrupt service routine to measure distance with an ultrasonic sensor.
JSN-SR04T DC5V Waterproof Ultrasonic Module Distance Measuring Sensor

A small modification allows the sketch to use both the interrupt service routine and the blocking "pulseIn()" statement that causes the processor to wait for the measurement to be completed. Notice the number of times the loop() subroutine is executed while waiting for each measurement to be completed.

Sample output - 
Measurement obtained by interrupt service routine only
======================================================
Number of times loop() executed while measurement being taken: 228
isr_start_occurred = 1, isr_end_occurred = 1, isr_change_occurred = 2
distance from interrupt service routine 28   cm

Number of times loop() executed while measurement being taken: 1360
isr_start_occurred = 1, isr_end_occurred = 1, isr_change_occurred = 2
distance from interrupt service routine 149   cm


Sample output - 
Measurement obtained by both 
interrupt service routine and "pulseIn()" statement
===================================================
Number of times loop() executed while measurement being taken: 1
isr_start_occurred = 1, isr_end_occurred = 1, isr_change_occurred = 2
distance from pulseIn() statement 27   cm
distance from interrupt service routine 28   cm


Number of times loop() executed while measurement being taken: 1
isr_start_occurred = 1, isr_end_occurred = 1, isr_change_occurred = 2
distance from pulseIn() statement 148   cm
distance from interrupt service routine 149   cm

Click on the button below to copy the sample sketch.